Postings in the same series:
Part I – Teaser/Introduction
Part II – The Installation
----------------------------------------------------------------------------------
In the last posting of this series I will share my personal experiences with Savision Vital Signs. There is much to say so let’s start.
What the f-word is going on!??
Many of us will recognize situations like these:
One moment all is well and all ICT systems are humming quietly. Users are happy, applications are functional, responsive and live is good. SCOM is quiet, not too much stuff coming in and what comes in is nothing special. Nice! But suddenly, out the blue, things start to go sour. A couple of phone calls come in – users complaining about lost connections, frozen applications, slow responses – and SCOM start to generate more Alerts. Application owners are pacing up there steps, worried looks on the faces of the DBA’s. The door of the ICT Managers office swings open, people rush in and out. Wow! ‘Houston, we’ve got a situation!’.
But where to start? Yes, SCOM has thrown some or even many serious Alerts, some DAs are painted red from top to bottom, computers are in red condition, network devices come and go, SQL boxes are having issues as well. But hey, what are the causes of this? SCOM will certainly aid you in pinpointing the direction(s) where to look, up to the level you have configured it, but today’s applications/servers/services are many times spread across multiple locations, servers/hosts, components so even when you know where to look, some specific drill downs are still required.
Like getting answers to: OK, SQL boxes X, Y and Z are having issues. But why? Servers D,E and F are troublesome as well. But why? SCOM gives good insight of what servers, services, sql boxes, cpu’s, disks, RAM and the lot which are having issues. But why is the cpu running 100% on the sql-server process? Why is the RAM being consumed for 99,99% by the IIS process? Why are the disk queue lengths as long as a dogs tail?
And this is where Vital Signs comes in. Like hiring a detective, a Sherlock-Holmes-in-the-box! 
When hiring a detective you always have an assignment. Not like ‘Duh! I am hiring you because you’re a detective and figure it out yourself whether I need your services and for what!’. No. With Vital Signs it’s the same. You have some ‘unsubs’ which need further investigation. You aim Vital Signs to those unsubs (servers) and it will do the rest.
The Science of Deduction and Analysis
So we know where to look. Vital Signs can take a deep dive into the Windows Server OS and SQL (Hyper-V as well since a few days, so it’s gaining momentum!), lets start.
SV01 is – besides a W2K08 R2 server – also a SQL box. Server SV02 is a W2K03 box. I have added both to Vital Signs: 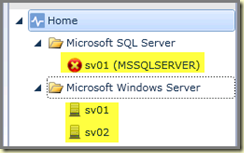
Oops! That’s not good! SV01 (SQL) is not OK. Let’s drill down: 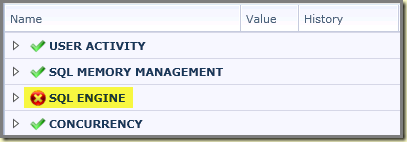
So the SQL Engine is not having a good time? Let’s check it out (notice the yellow high lighted area): 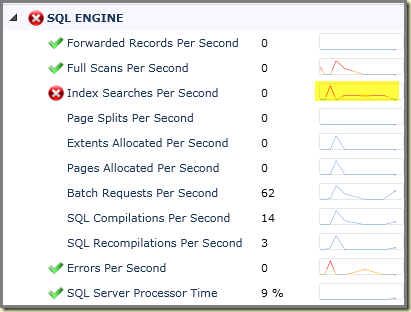
Wouldn’t it be nice to have a bigger graph of it? So let’s drop & drag it to the middle pane! 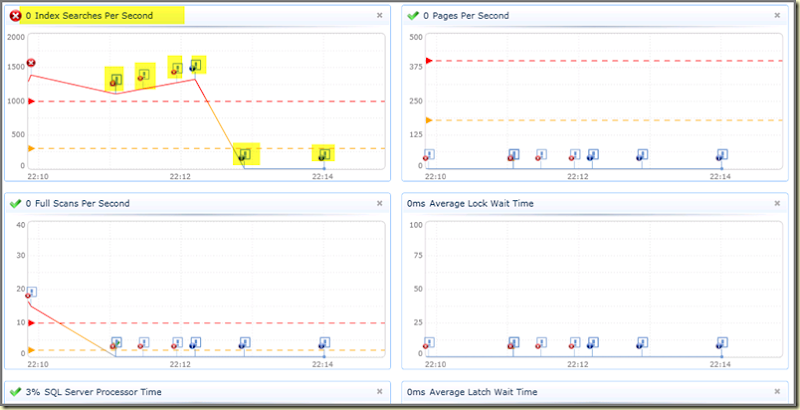
Wow! Let’s zoom in more. Now we know what's wrong, but not what’s causing it. Let’s zoom in a little bit more. The yellow highlighted area’s contain more information: 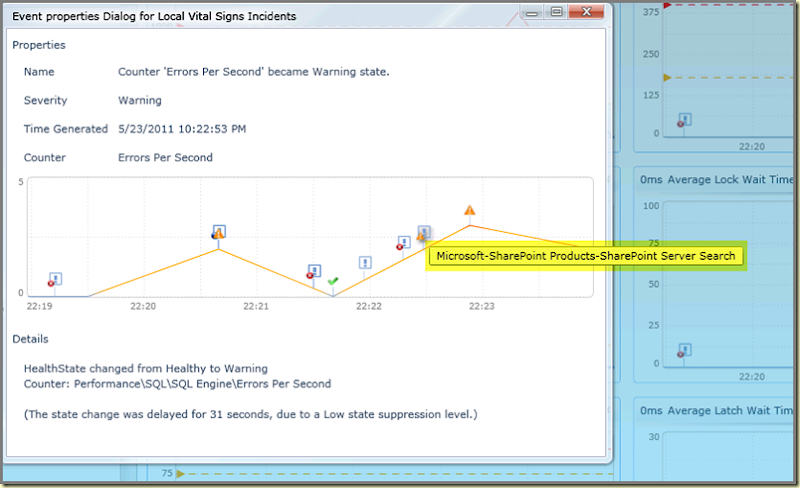
Now it’s time to take a deeper dive into the SQL databases itself: 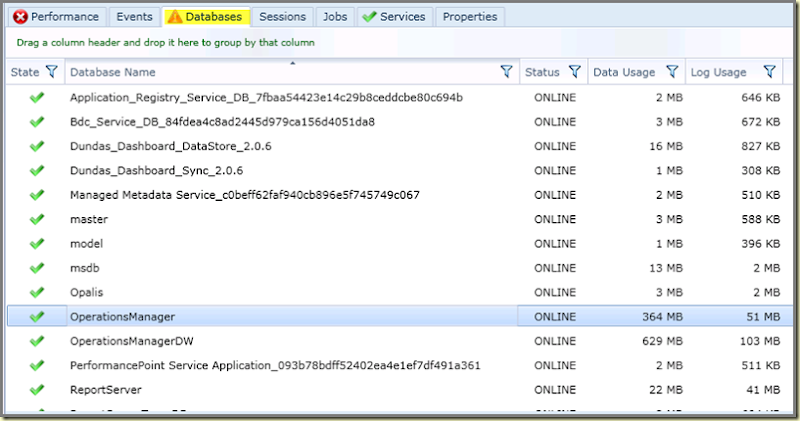
Select a database and the lower pane will show this: 
Also note the tabs, revealing more information about a selected database: 
So now I can look INTO the database itself. Just drag & drop, and you will see what’s happening. On top if it all, the connection with SCOM aides you in relating issues to Alerts. Also the additional information about the databases is a good help.
Vital Signs also enables you to see whether the issue you’re investigating is something of the past 24 hours or not. Just adjust this time slider and the Views will be adjusted on the fly! 
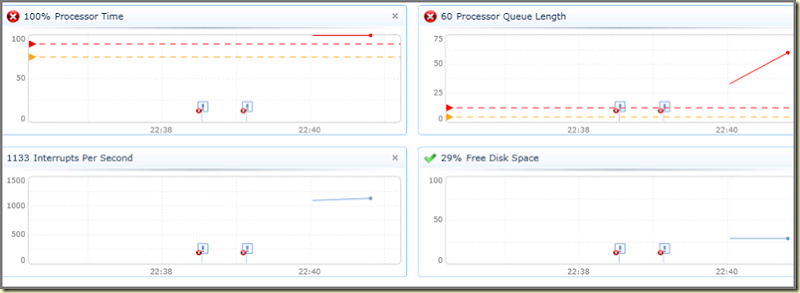
The same goes for the Microsoft Windows Server dashboards. They offer the same flexibility, drag & drop features, zooming into details and easiness of usage. Some screenshots: 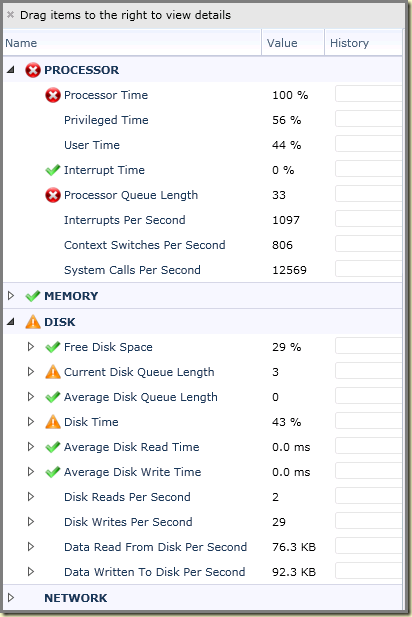
Conclusion:
The days running Perfmon in order to get to the bottom of a nasty situation, are gone. Where Perfmon stops, Vital Signs kicks in! It takes a deep dive into a product and shows what’s happening, real-time. If needed, you can take a deep dive into older data in order to pinpoint it even more. The connection with SCOM, relating Alerts with certain changes in measured performance is really a huge help in order to crack a tough situation. Also all the information to be found in the single console of Vital Signs makes it easier to trouble shoot. No more need to open many consoles. Vital Signs provides much solid information.So where SCOM shows useful state information, Vital Signs delivers deep and detailed performance monitoring. Bringing these two things together delivers much added value.
For now Vital Signs covers these three products: SQL, Windows Server and Hyper-V. But when looking into the installation folder of the software this is what I found:
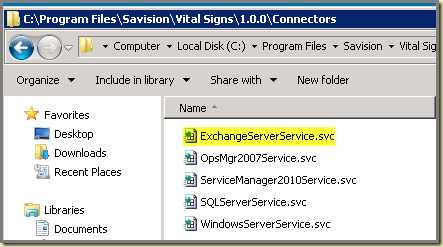
So there is more to come. Vital Signs is a framework after all, enabling Savision to deliver more and more product-specific dashboards. Nice! Can’t wait to see the latest releases.
Wish Vital Signs was there in my days being a Systems Engineer! Would have most certainly helped me out in many situations. So test drive it and be impressed, just like me. No rocket science needed to get it up & running.

No comments:
Post a Comment