Postings in the same series:
Part II – The Installation
Part III – Sherlock Holmes is back!
----------------------------------------------------------------------------------
For some time now Savision (the company behind the product Savision Live Maps) has put a new product on the market: Vital Signs 
What it is and what it does? As Savision states: ‘…Real-time performance monitoring and troubleshooting for Microsoft Windows Server and SQL Server…’.
But hold on. I have been told it has Dashboards for AD and Exchange as well. And soon there will be a dashboard for Hyper-V! Nice!
Opposite of Live Maps, this product doesn’t require SCOM. It can work together with SCOM (or SCSM for that matter) through a connector, but it isn’t a requirement.
Installation Experience
Since my curiosity was aroused, I contacted Savision and they send me all the stuff I needed. Also documentation about how to install it. But I wanted to test it, so I didn’t read anything. No RTFM… Why? Since many times I find people doing the same. So it is a good test in order to see how bullet proof the product is.
And without any hassle, it installed itself. No issues what so ever. Nice!
Configuration Experience
When Vital Signs is installed it requires some configuration tasks. Even though the (web) interface is totally different compared to Savision Live Maps, it is very intuitive so one doesn’t need to be a rocket scientist. It uses the same lay out as the SCOM/SCSM console with two wunderbars: Administration and Analysis.
This way one feels him/her self at ease with the interface.
First Impressions
After the configuration tasks were finished (still I hadn’t read a single word of the documentation!) it was time to take a look what it does. So I added a SQL server and cycled through the available views. Since one picture says more than a thousand words, take a look at these screen dumps:
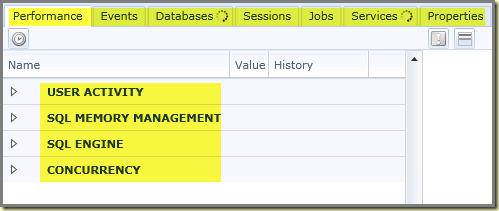
As one can see, SQL server is divided in sections like User Activity, SQL Memory Management, SQL Engine and Concurrency.
Per section there is a broad range of counters available, which can be dragged on to the dashboard on the right: 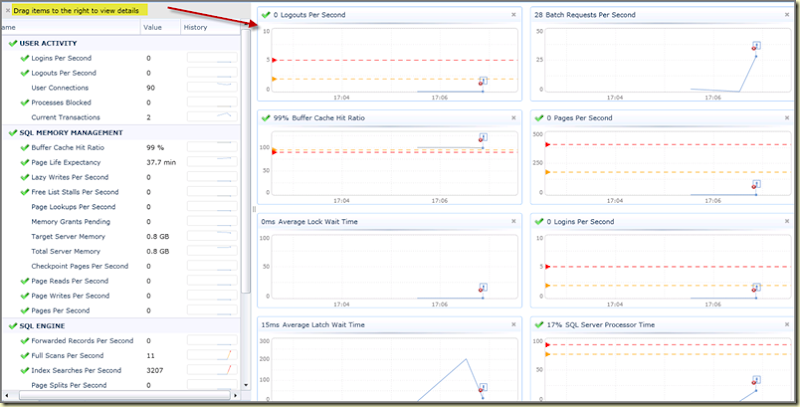
And when one takes a close look, there are also small dashboards per counter available: 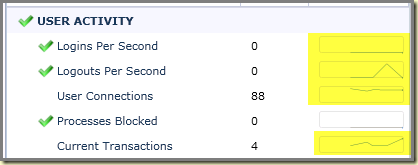
Let’s drag one on to the bigger dashboard: 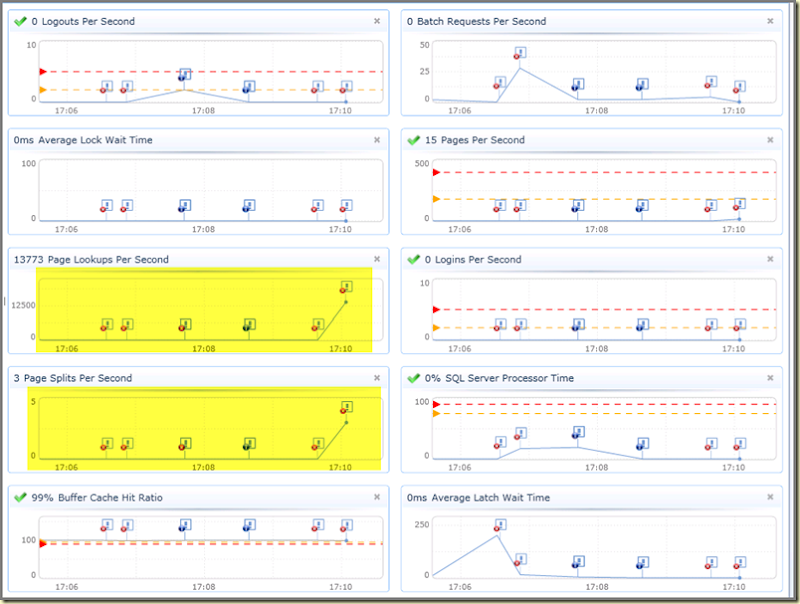
But that’s awesome! Many times customers of mine asked for Dashboards like those. And not just that, but also more information about SQL. And look what Vital Signs does! This is great! So now customers can tap into a SQL server and get ALL the information they require. Information which the SQL MP – sadly – doesn’t deliver (yet?).
So what does the SCOM Connector do? As Savision states: ‘…Vital Signs will read alert and incident data from SCOM and SCSM and display them in context of the affected system. Additionally, tasks are created in SCOM for launching Vital Signs in context of the selected system…’.
Basically it means that one is capable of better troubleshooting: SCOM will trigger an Alert and Vital Signs allows one to take a deeper dive into the Alert by showing Tasks which are relevant to that Alert.
In other postings I will take a deeper dive into this new Savision product and show some nice dashboards. Also I will cover the installation and stuff like that. For now I can say that I am very impressed. For a 1.0 version it looks great and awesome. Products like these add much value to any SCOM implementation.
No comments:
Post a Comment