First of all, recently I posted an article about the OpsMgr R2 add-in for Visio. In the conclusion of that posting I mentioned Savision Live Maps because it delivers the drill down functionality which – to my personal opinion – the OpsMgr R2 add-in for Visio lacks.
Secondly, Savision has recently released the latest version of this product. It works with OpsMgr R2 ‘only’ and contains many new features. Other features, already present in previous versions, have been enhanced.
In order to make a good comparison between both products I feel myself obliged to do so based on testing the latest versions of both products. This posting will be about Savision Live Maps 4.1. A future posting will contain a comparison matrix.
Why using a product like Savision Live Maps?
Suppose you have an OpsMgr R2 Management Group which monitors many objects like servers, websites, processes, services, Distributes Applications, network devices and -connections. How do you stay on top of things? How to connect everything together so a solid overview is created?
Of course, delegation does help. So certain people/departments are responsible for the mail flow where others are responsible for the network devices, server hardware and so on. But delegation also introduces a risk. How to bring it all together? Suppose there is a glitch in the network, so the mail doesn’t get out? Or a bunch of Exchange servers died because the upgrade of the underlying SAN went wrong. How to get the message out from the network/SAN guys to the ‘mail guys’? How to get/keep all departments connected with each other? Many times islands come to be which are hard to connect.
In stead of having every department involved looking at a list of ‘only’ their servers/objects in a green/yellow or red state, they look at a map, topology, dashboard, flow of business processes or the layout of a datacenter. Now everything is not only connected but also visualized where OpsMgr R2 delivers the real time state information. This is really a huge difference. And the real power here is not found in just one visualization but multiple which are connected with each other. So one can drill down to the real issue here. And since it is all connected to OpsMgr, detailed information is always at a hands reach!
Installation
Before the software can be used some installation work needs to be done. The installation guide is lean & mean and easy to understand. There are five different components: 
- Live Maps Authoring Console
For creating Live Maps. Needs only the OpsMgr Console to be present on the system where it is installed. I use W7 x64 and it works great on that system.
- Live Maps Management Packs
There are two MPs. One is sealed and the other isn’t. The latter is used for storing Live Maps.
- Live Maps OpsMgr Extensions
Before the Live Maps can be shown in the OpsMgr Console, this extension needs to be installed.
- Live Maps Web Console
Besides using the OpsMgr Console to view the Live Maps and use it’s functionality, Live Maps also has a web based console. This is great since now the Live Maps can be shown on any system running IE. And what systems don’t have that software? This component needs IIS in conjunction with .NET Framework 2.0, 3.5 SP1 and ASP.NET 2.0.
- Live Maps Windows Gadget
This is a really cool feature. It connects to the Live Maps Web Console and enables the user to select any View available in Live Maps. Of course, Windows Vista or 7 is needed. What? Still on XP Pro? Duh! Time to upgrade to Windows 7!
For my test environment I installed the Live Maps Web Console on a W2K08 SP2 x64 based server, running IIS. I installed the Live Maps Authoring Console on a W7 X64 based client.
And I must say, the installations went really smooth. Many times I have installed third party software for OpsMgr but on numerous occasions I ran into some snags. Not here. Not now. After the installation everything just worked! Great!
Time to move on.
Authoring Console
When the Authoring Console is started for the first time, it will ask for a license key. Also two MPs will be imported to OpsMgr R2. At every startup this screen is shown: 
Provide the FQDN of the RMS and the credentials. Based on this information a connection to the RMS will be made. Now you are ready to rock!
This is the place where it all happens. Here the monitored OpsMgr objects (what ever these are: servers, clients, processes, services, websites, databases, network devices and so on) are put into one or more views (aka Live Maps).
And really, the more, the merrier. It is better to create multiple Live Maps and connect them (aka nested maps) then using one map only and thus loosing focus since too many objects are present in that map. Keep every Live Map in such a manner that it just shows the essentials and use underlying maps to show more details. Like this: Live Map of the US > Live Map of Texas > Live Map of every Data Center in TX > Live Map of every Server Rack per Data Center.
How to create a Live Map?
When creating a Live Map many different lay-outs/approaches can be used. Like geographical maps (already available in the Authoring Console), Business Process (wizard based), Sites and Subnets (wizard based, even with AD connectivity) and so on: 
Also Visio drawings (exported as an image) can be used here. So a Live Map can be ‘as real’ as needed. When the organization uses many Visio drawings for representing the IT infrastructure, why not use it in Live Maps?
When one starts with an empty drawing anything can be created. One can insert images, create all kind of shapes, add lines/arrows which can be connected (thus monitored!) to OpsMgr objects – like network connections – as well. The authoring pane isn’t there to frustrate the creator of Live Maps but to aid and assist. 
What kind of Live Map(s) to create is totally up to you, or better, the IT needs of the organization. As far as I have seen are the Wizards of the Authoring Pane really doing a good job and enables one to create a solid and valuable series of Live Maps in the matter of minutes. Of course, planning ahead (what do I want to be shown in the Live Maps and how) is needed. But just go ahead and try.
An Example
Suppose you work for an insurance company where many insurances are sold online. Customers can also check in with a personal account and modify/add assurances as needed. Here the websites are a very important part. Also the underlying SQL database servers, SQL databases, SQL Agent jobs and so on are very important.
When these are monitored in OpsMgr these components can be visualized in a Live Map like this (I know some depicted items/flows aren’t 100% correct, but hey it is an example, nothing more…):

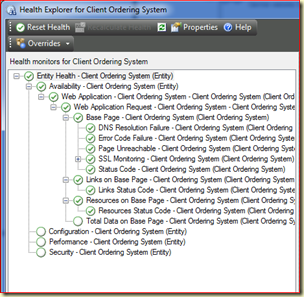
In this Live Map, all objects are clickable. Like the Perspective View. Here one can select the OpsMgr Views we all know, like Alert, Event, Performance, Diagram and State View. Also the Health Explorer is available for these monitored objects: 
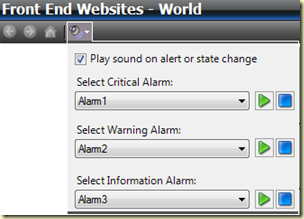
Another feature which really rocks is the ability to add sound. So no one has to be hired for looking all day at the screens… :). But seriously, the ability to add sound to OpsMgr when an Alert occurs is a much heard request.

The Live Map ‘Front End Websites - World’ does not only have perspective Views but do also have hotspots. For instance, when hovering the cursor over the name ‘US’ it links to another Live Map, depicting the US and its data centers:


Per data center a floor map can be shown with all the available racks. Per rack all available servers can be shown. Everything – per Live Map – can be connected (nested) with each other, allowing for a quick drill down to the object(s) where an issue has occurred.
Web Console
Creates a great platform to use the Live Maps without the need to install all kind of additional software (OpsMgr Management Console and Live Maps Extensions). Only Internet Explorer is needed on the system connecting to it. Also it creates the possibility to integrate Live Maps into SharePoint.
Conclusion
Savision Live Maps adds many good features to OpsMgr R2 and takes it to a higher level. Instead of having many different departments/people looking at the state of a subset of servers/objects, everything gets connected and shown into visual representations which brings back the focus to the IT department. With the ability to add sounds when an Alert or State Change occurs on a Live Map, there is no need to keep an eye at all times on the screens. This way it becomes a timesaver in multiple ways as well: With a quick glance one knows the status of the environment. And when an issue does arise, with the nested maps one can drill down very fast and efficient to the real cause of it.
The Authoring Console gives the creator of Live Maps great freedom and flexibility. Even though the Authoring Console looks very basic, the possibilities are almost endless, without getting overwhelming or beyond understanding. The website of Savision has many instruction video’s freely available which show how to go about it when creating different kind of Live Maps or using Share Point integration. Within a matter of minutes one knows how to make it work.
Where the Visio Add-in stops (showing a visual representation of the IT infrastructure) Savision Live Maps starts. With the drill down functionality, the ability to add sounds, the Web Console, the Windows Gadget, Live Maps can be shown any where, any time, any place. To my personal opinion this tooling can not be missed any where. When you run OpsMgr R2, start using Savision Live Maps today. And be awed and impressed just like me.
Pricing
Yes. I hear you. ‘Start using Live Maps…’ Duh! But wait! There is a free version. It offers every thing of the paid version. It allows one to create 5 views. To be found here. One needs to specify the exact name of the Management Group. Based on this information a license key will be generated.
No comments:
Post a Comment